The Cities Most at Risk for Plumbing Disasters This Moving Season
Moving can be exciting. It can mean a fresh start, a life milestone, and a new environment. At the same time, the logistics and uncertainty of moving have made it one of life’s most stressful events and one of the worst times to discover your new home has a plumbing problem.
Between May and September, millions of Americans pack up and relocate, often into houses they’ve never spent a summer or winter in, with pipes they’ve never tested, in cities where the infrastructure beneath the streets is older than their parents. In the Northeast and Midwest, the issues can be sudden: a hard freeze expands water inside pipes by 9%, bursting them outright. In the Sun Belt, the damage is quieter with years of intense heat shrinking and expanding clay soils, putting pressure on PVC pipe joints, and accelerating root intrusion into sewer lines, until the day a new homeowner discovers a problem that has been building for a decade.
Most movers inspect the walls, the roof, and the appliances. Very few think to ask about the pipes, what they’re made of, how old they are, or what the water running through them is doing to them. That oversight can be expensive.
To help movers make smarter decisions, Roto-Rooter analyzed 46 cities across five categories of plumbing risk:
- Real-world service call volume
- Housing age
- Water hardness
- The prevalence of homes lacking complete plumbing facilities
- The age and material composition of underground pipe infrastructure
The result is the Roto-Rooter Plumbing Risk Index: a data-driven ranking of the 10 cities most likely to hand new residents a plumbing emergency and the 10 that offer more peace of mind.
A Quick Note on Two Key Risk Factors
Before diving into the rankings, two factors are worth a brief explanation because they appear throughout.
Water hardness is measured in milligrams per liter (mg/L), parts per million (ppm), or grains per gallon (gpg). All three refer to the same thing: how much dissolved calcium and magnesium are in a city’s water supply. Hard water leaves limescale inside pipes and appliances over time. Very soft water, by contrast, can be corrosive, chemically hungry enough to leach copper or lead from the inside of metal pipes. Both extremes create plumbing problems, just different ones.
Pipe material determines how long underground infrastructure lasts and how it fails. Cast iron mains installed before 1960 fail at nearly ten times the rate of modern PVC, and 86% of cast iron pipe in the US is now over 50 years old. The material of the water mains serving your street is largely invisible to residents, but it shows up directly in service call frequency and water quality events.
The 10 Most At-Risk Cities
1. Kansas City, MO/KS (Risk Score: 7.8/10)
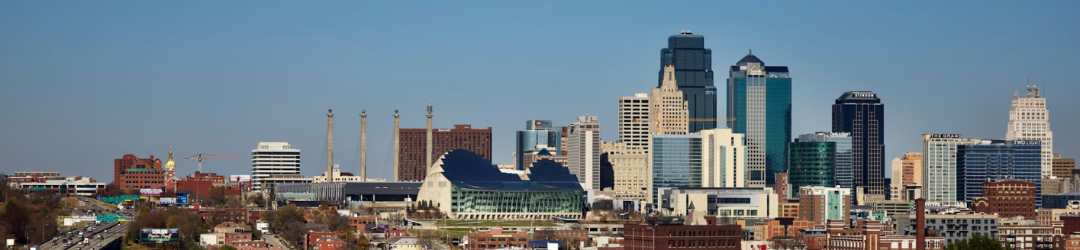
Kansas City tops the list as the most at-risk city, largely due to its most significant plumbing concern, which is water hardness. At 300 ppm (17.5 gpg),5 the city’s municipal supply ranks among the most mineral-laden in this study, sourced from the Missouri River, which carries significant calcium and magnesium loads from Midwest limestone geology. At that concentration, limescale accumulates at a rate that measurably reduces water heater efficiency, water pressure, narrows pipe interiors, and shortens appliance lifespans across the city’s housing stock, regardless of infrastructure age.
The typical home was built around 1963 (62.6-year average), with 20% of the housing stock predating 1939.2 The city sits in USU Region 6, one of nine geographic zones used by Utah State University’s 2023 national water main study to benchmark pipe materials and failure rates across the U.S., where the water main break rate averages 14.6 per 100 miles per year,1 and cast iron and ductile iron remain the dominant underground main-line materials. Very hard water acting on aging metallic infrastructure accelerates both internal limescale buildup and external corrosion simultaneously, resulting in sustained demand for excavation-related service calls.
In 2025, data from Roto-Rooter recorded more than 37,000 service calls, equating to 58.9 per 100 households. The notably high excavation volume reflects underlying infrastructure deterioration that routine drain cleaning alone cannot resolve.
2. Wilmington, DE (Risk Score: 7.8/10)
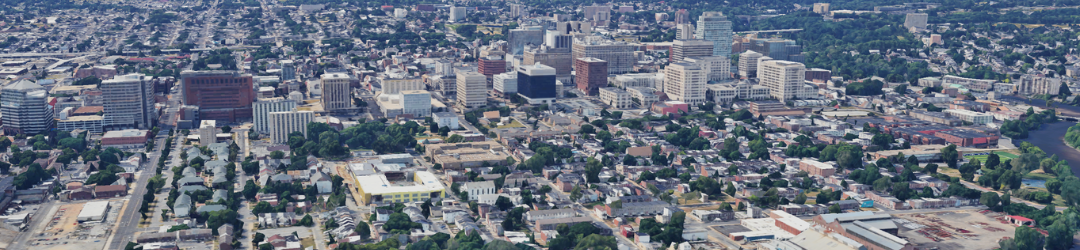
Wilmington ranks second among the top ten most at-risk cities for plumbing issues, driven by a combination of aging housing stock, cast iron main-line infrastructure, and corrosive soil conditions that tend to worsen gradually over decades. The typical home was built around 1953 (72.7-year average), and 43% of all homes predate 1939,2 a concentration of pre-war housing that translates directly into widespread residential plumbing at or beyond its expected service life.
Wilmington sits in USU Region 8, where the water main break rate is 16.4 per 100 miles per year, which is among the highest nationally.1 Water hardness is moderately hard at 117 ppm (6.8 gpg),6 but the more significant infrastructure threat comes from corrosive Eastern Seaboard soils that accelerate the deterioration of cast iron water mains in ways that surface-level inspections rarely reveal. Delaware’s cold winters also add meaningful freeze–thaw stress to a plumbing network already under strain.
Service data confirms what the infrastructure profile predicts. In 2025, data from Roto-Rooter indicates 62.0 service calls per 100 households, tied for the highest per-capita rate in the study. That equates to more than 22,000 annual service calls across roughly 36,000 households, indicating sustained plumbing distress that residents can feel.
3. Camden, NJ (Risk Score: 7.6/10)
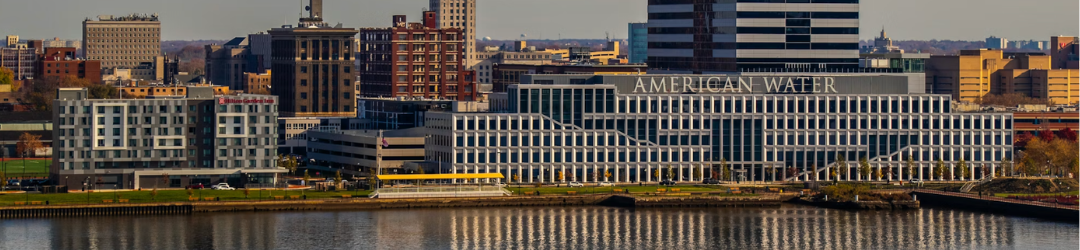
Camden’s risk profile reflects a small, dense urban environment where aging housing, cast iron infrastructure, and cold-climate stress combine to produce plumbing issues at a rate that outpaces what its size would suggest. The typical home was built around 1954 (71.9-year average), with 39% of stock predating 1939.2 The city’s pre-war housing concentration rivals larger Northeast cities in proportion. Camden sits in USU Region 8 with cast iron as the dominant underground material and a regional water main break rate of 16.4 per 100 miles per year.1 Water hardness is moderately hard at 123 ppm (7.2 gpg),7 and cold winters introduce meaningful freeze-thaw stress on infrastructure already operating in the latter portion of its life.
The depth of that distress is most apparent in service demand, with 56.8 service calls per 100 households, among the highest per-capita rates in the study. For a city of nearly 28,000 households, over 15,000 annual service calls represent a level of ongoing plumbing demand that speaks directly to the condition of its plumbing infrastructure.
4. Bridgeport, CT (Risk Score: 7.5/10)
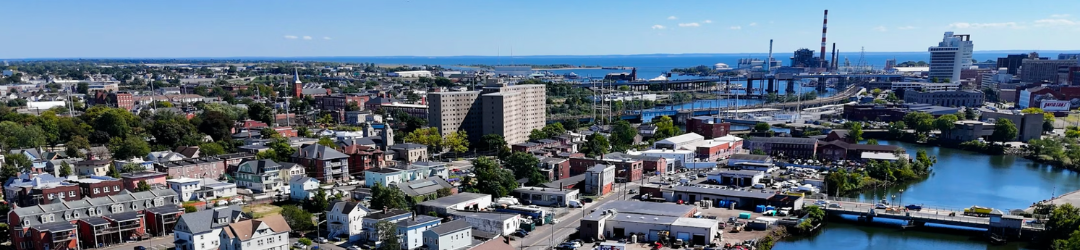
Bridgeport ranks among the higher-risk cities on this list due to its hard water conditions and aging cast iron infrastructure, a pattern commonly seen across cities in the Northeastern United States. The typical home was built around 1956 (70.1-year average), with 33% of the housing stock predating 1939.2 Water hardness averages 168 ppm (9.8 gpg),6 sourced from a network of eight reservoirs, making the city’s water harder than that of most Northeast municipalities due to its blend of surface and groundwater sources. At that hardness level, limescale accumulates progressively on interior pipe walls, narrowing water flow, while external corrosion simultaneously weakens pipe structure from the outside. Bridgeport sits in USU Region 8, where the water main break rate is 16.4 per 100 miles per year1 and cast iron remains the dominant underground material. Cold winters add freeze–thaw stress to infrastructure already approaching the end of its design life.
In 2025, data from Roto-Rooter indicates 59.4 service calls per 100 households. For a city of roughly 60,000 households, more than 35,000 annual service calls document the combined effects of hard water acting on aging pipes across its housing stock.
5. St. Louis, MO (Risk Score: 7.1/10)
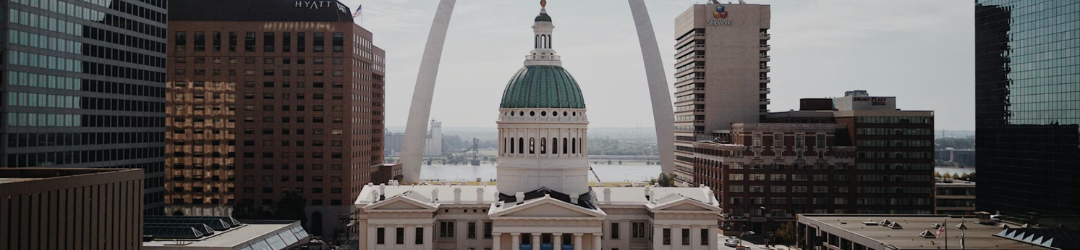
With an average housing age that ranks among the oldest in this study, St. Louis presents unique infrastructure risks for those looking to move to the city. The typical home was built around 1947 (79.3-year average), and 58% of all homes predate 1939,2 meaning the majority of the city’s residential plumbing was installed during an era when galvanized steel, cast iron, and lead solder were the primary materials available. All three materials are now at or approaching the end of their functional lives across much of the housing stock. The city’s water hardness measures 140 ppm (8.2 gpg),6 classified as hard and sourced from the Missouri and Mississippi Rivers, carrying a significant mineral load from Midwest limestone geology. The city sits in USU Region 6 (Midwestern United States), where the water main break rate of 14.6 per 100 miles per year exceeds the national average of 11.1,1 and cast iron and ductile iron remain the dominant underground materials.
In 2025, data from Roto-Rooter shows more than 62,000 service calls, or 36.0 per 100 households, with particularly high demand for drain cleaning, excavation, and water restoration. The data reinforces a question many St. Louisians face about when, not if, plumbing failure will occur.
6. Buffalo, NY (Risk Score: 7.1/10)
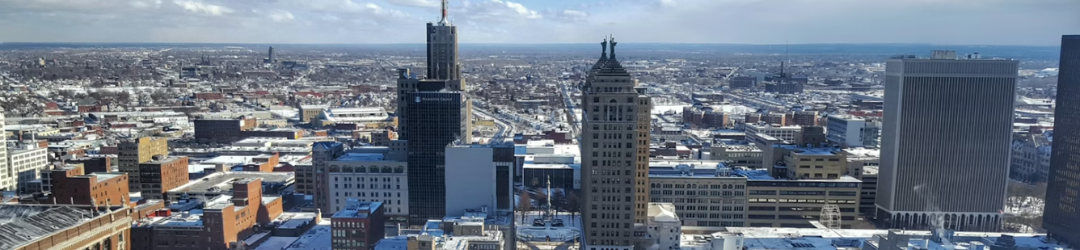
Buffalo earns its top 10 ranking the hard way, with the oldest average housing stock in this entire study, aging underground pipe infrastructure, and winters severe enough to crack pipes on their own. The typical home was built around 1944, the oldest average in the study at 82 years, where 61% of all homes predate 1939.2 The underground infrastructure reflects the same story with vintage cast iron water mains in USU Region 8, where the break rate is 16.4 per 100 miles per year.1 Water hardness runs at approximately 180 ppm (10.5 gpg),8 drawn from Lake Erie through the Great Lakes limestone basin, adding mineral stress to already aging pipe systems.
What sets Buffalo apart from other Rust Belt cities is its harsh winter climate. According to the USU study, freeze stress is the leading cause of circumferential cracking (accounting for 48% of failures nationally),1 and Buffalo’s freeze-thaw cycles are among the most severe. This stress directly impacts aging cast-iron pipes. Despite these risks, Buffalo shows some resilience, with 21,000 service calls amounting to a relatively moderate 15.7 per 100 households.
7. Dayton, OH (Risk Score: 6.8/10)
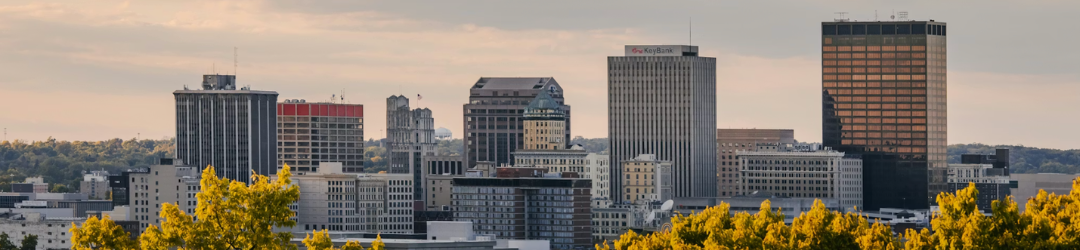
Dayton’s aging housing, hard water, and century-old iron pipes have long kept infrastructure investment focused on keeping pace rather than getting ahead. The city is now in the middle of significant water and sewer improvements, which could meaningfully shift its risk profile in the years to come, but the underlying conditions that earned it a place on this list run deep. The typical home in Dayton was built around 1953 (73-year average),2 with a significant concentration of pre-1939 housing in the city’s historic core built when galvanized steel and cast iron were the only residential pipe options available. Water hardness measures 155 ppm (9.0 gpg),6 classified as hard and sourced primarily from the Great Miami River Buried Valley Aquifer, which flows through dolomite and limestone geology. Dayton sits in USU Region 6, with a water main break rate of 14.6 per 100 miles per year,1 and cast iron and ductile iron remain the dominant underground materials. Homes lacking complete plumbing facilities account for 0.7% of housing,3 which is above the study average.
More than 26,000 service calls, or 38.2 per 100 households, is particularly notable for a city of Dayton’s size and reflects the sustained pressure that hard water and aging pipes place on the city’s housing stock year-round.
8. Cleveland, OH (Risk Score: 6.2/10)
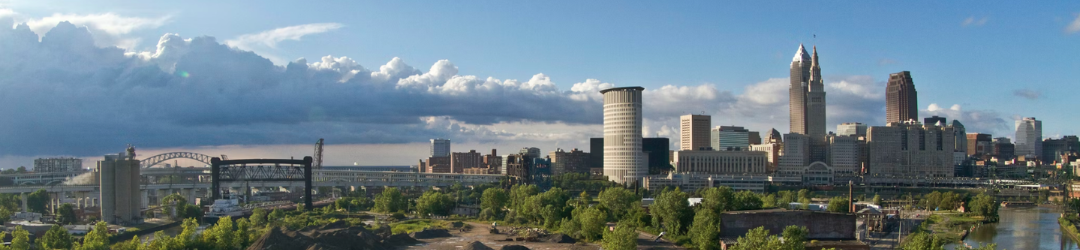
Cleveland’s placement on this list will come as little surprise. Pre-war housing density, aging cast iron and ductile iron piping, and freeze-thaw cycles that push already overstretched systems past their designed service lives define a risk profile that mirrors some of the worst on this list. The typical home was built around 1949 (76.7-year average), and 50% of all housing predates 1939,2 positioning itself among the highest pre-war housing concentrations in this study and a clear indicator of widespread aging residential plumbing. Water hardness is 125 ppm (7.3 gpg), sourced from Lake Erie.9 Cleveland sits in USU Region 6 with a water main break rate of 14.6 per 100 miles per year1 and cast iron and ductile iron as the dominant underground materials.
Very cold winters impose freeze–thaw stress that accelerates circumferential cracking failures. The city’s lead service line replacement program is active, but the gap between its pace and the scale of the problem remains substantial. With 12.0 service calls per 100 households (over 23,000), the city also shows elevated water-quality service volume, consistent with a system where pipe corrosion and mineral buildup generate ongoing maintenance demand.
9. Baltimore, MD (Risk Score: 6.1/10)
Baltimore is in many ways the textbook case for Northeast industrial city infrastructure risk. Dense pre-war housing, century-old water mains, and corrosive soil conditions are wearing down a pipe network that spans more than 4,000 miles faster than replacement programs can address it. The typical home was built around 1953 (73.2-year average), and over 120,000 homes, 41% of all households, predate 1939.2 Baltimore sits in USU Region 8 with cast iron as the dominant underground pipe material and a water main break rate of 16.4 per 100 miles per year.1 Water hardness comes in at 100-130 ppm (moderately hard),10 and corrosive Eastern Seaboard soils steadily weaken metallic pipe in ways that surface-level inspection rarely surfaces.
Aging infrastructure, corrosive soil chemistry, and cold winters create conditions where pipe failures are frequent. Service call data shows more than 48,000 calls (16.5 per 100 households), a per-capita rate consistent with a city whose plumbing is well past the midpoint of its expected service life.
10. Pittsburgh, PA (Risk Score: 5.9/10)
Pittsburgh rounds out the top ten, where pre-war housing and hard water have spent decades compounding stress on aging cast iron infrastructure. A major overhaul is underway with completion expected by 2027, but the baseline data still tells a familiar Rust Belt story. The typical home was built around 1951 (74.9-year average), with 48% of all housing predating 1939,2 nearly half the market built during an era when galvanized steel and cast iron were the only residential pipe materials. Pittsburgh sits in USU Region 8 with cast iron as the dominant underground pipe material and a water main break rate of 16.4 per 100 miles per year.1 Water hardness is 150 ppm (8.8 gpg),11 classified as hard and sufficient to generate meaningful scale accumulation in water heaters and progressively narrow pipe interiors across the housing stock.
Cold winters impose additional freeze–thaw stress on a cast iron network that is approaching or has already exceeded its expected design life. More than 21,000 service calls, or 13.7 per 100 households, reflect Pittsburgh’s steel-era housing stock and aging plumbing infrastructure.
Middle of the Pack
The remaining 26 cities (those positioned between the top high-risk and bottom low-risk groups) score between 2.6 and 5.6. These cities carry moderate or mixed risk, meaning factors like the specific neighborhood, the decade the home was built, and the local water source will carry more weight in an individual moving decision.
Cities just outside the top ten most at risk
- Cincinnati, OH (5.6) has a 71-year average home age and hard water at 138 ppm, a classic Midwest risk profile that shares more with the top ten than its rank suggests.
- Philadelphia, PA (5.6) has 40% pre-1939 housing and cast iron infrastructure in Region 8; its per-capita service rate of 5.2 per 100 households understates the risk concentrated in the city’s oldest neighborhoods.
- Chicago, IL (5.6) ranks lower than its raw call volume suggests once adjusted for its 1.27 million households. The city’s 65,777 service calls produce a per-capita rate of just 5.2 per 100 households, which is moderate. However, that average obscures the underlying risk: Chicago has 412,000 lead service lines, more than any other city in the U.S., meaning a significant share of its older housing stock is served by pipes that can leach lead directly into drinking water. Its blisteringly cold winters add severe freeze-thaw stress on top of that.
- Boston, MA (5.1) has some of the highest pre-1939 housing concentration of any city in this section at 46.8%, higher than Baltimore and Philadelphia in proportion, and a clear indicator of widespread aging residential plumbing.
Cold-climate cities that don’t make the top ten but deserve extra consideration
- Minneapolis, MN (5.1) combines a 68-year average home age with 44% pre-1939 housing and some of the most severe freeze-thaw winters on the index; a profile that would place it in the top ten if its water were harder or its housing older.
- Indianapolis, IN (5.0) is driven in the rankings primarily by hard water at 205 ppm, compounded by a 0.7% rate of homes lacking complete plumbing, above average, and reflective of ongoing maintenance in the city’s older urban core.
Northeast and Mid-Atlantic markets
- New York City (4.9), Providence, RI (4.8), Middlesex, NJ (4.8), and Westchester County, NY (4.7) all sit in USU’s Region 8 with cast iron underground piping and older housing stock. New York’s soft water supply is the main moderating factor keeping it out of the top tier of at-risk cities. Norfolk, VA (4.7) stands out within this group with 28.9 service calls per 100 households, a notably high per-capita rate, and cast-iron pipe infrastructure, despite falling outside the top ten. Long Island, NY (4.2) and Northern Virginia (4.1) carry Region 8 infrastructure risk; however, this is partially offset by newer housing.
Hard water markets
- Salt Lake City, UT (4.9) has the hardest water in the entire study at 327 ppm, a geological consequence of the ancient Lake Bonneville lakebed beneath the city, and that alone warrants serious attention from prospective movers regardless of the moderate overall score.
- Phoenix, AZ (3.6) comes in at 275 ppm and San Antonio, TX (3.1) at 257 ppm, with Dallas, TX (3.1) at 240 ppm. At these concentrations, scale accumulation inside pipes and water heaters is a long-term certainty regardless of how new the home is. Omaha, NE (3.9) adds moderately hard water at 171 ppm to a 56-year average home age, a moderate version of the same dynamic.
Sun Belt and West Coast markets with specific infrastructure concerns
- San Francisco, CA (4.9) and Los Angeles, CA (4.2) sit in the only US region where asbestos cement pipe has historically dominated the underground network, adding a layer of infrastructure risk not present in most other Sun Belt markets. San Francisco’s 1.5% rate of homes lacking complete plumbing is the highest in the study and is a separate signal of housing deterioration.
- New Orleans, LA (3.7) deserves a specific callout: its 65-year average home age, corrosive soil, and land subsidence create a risk profile in its historic neighborhoods that the city’s overall score significantly understates.
- Birmingham, AL (3.8), Columbus, OH (3.7), Denver, CO (3.7), Fort Lauderdale, FL (3.9), and Atlanta, GA (3.1) round out the lower-middle range, each carrying one or two moderate risk factors, whether hard water, aging housing, or warm-climate pipe stress, rather than the compounding combination that defines the top ten at-risk cities. Two cities here are worth a second look despite their scores: Fort Lauderdale and Atlanta both generate nearly 30 service calls per 100 households, a volume more consistent with higher-ranked cities and a signal that their overall scores may understate the day-to-day maintenance reality for residents.
The 10 Least At-Risk Cities for Plumbing Problems
10. Tampa, FL (Risk Score: 3.0/10)
Tampa’s relatively young housing stock (45.6-year average) and PVC-dominant infrastructure in USU Region 7 (Southeast) keep its overall risk moderate, but water hardness is the standout concern. At 186 ppm (10.9 gpg),12 sourced from the Hillsborough River and supplemented by groundwater, Tampa’s water is classified as very hard; high enough to cause meaningful scale accumulation in water heaters and appliances regardless of how new the home is. Just 8.3% of homes predate 1939,2 so aging pipe risk is low, but those looking to move to Tampa should budget for a water softener. Tampa’s warm, humid climate also accelerates root intrusion into sewer lines year-round.
9. Houston, TX (Risk Score: 2.9/10)
Houston’s favorable score reflects its relatively young housing stock (44.2-year average) and PVC-dominant infrastructure in USU Region 5 (Texas and Gulf South). Pre-1939 homes account for just 4.1% of the market.2 Hard water at 205 ppm (12 gpg)13 is the primary concern, sourced from surface reservoirs and carrying a significant load of minerals, and will cause measurable scale accumulation in water heaters and appliances over time, regardless of pipe age. Houston’s warm, humid climate also accelerates root intrusion into sewer lines.
8. Orlando, FL (Risk Score: 2.6/10)
With an average home age of 38.4 years and just 2.6% of its housing stock predating 1939, Orlando sits at the younger end of the spectrum in this study.2 The city sits in USU Region 7 with PVC as the dominant pipe material. Water hardness is moderately hard at 129 ppm (7.5 gpg),6 sourced from the Floridan Aquifer through limestone geology, harder than most Florida cities and sufficient to generate meaningful scale buildup in water heaters over time.
7. Miami, FL (Risk Score: 2.5/10)
Miami benefits from relatively young housing and a pipe network built largely in the modern era, earning a favorable overall risk score, though longer-term water quality pressures specific to South Florida are worth keeping in mind. The typical home was built around 1980 (46.5-year average), with just 3% of homes predating 1939.2 Water hardness is a moderate 94 ppm (5.5 gpg),13 sourced from the Biscayne Aquifer. The primary risk factors here are not infrastructure age or mineral content, but rather saltwater intrusion into the aquifer as sea levels rise and the elevated chlorination required to treat an increasingly vulnerable groundwater source, both of which have significant long-term implications for plumbing and appliance longevity.
6. Honolulu, HI (Risk Score: 2.4/10)
Honolulu presents one of the more favorable plumbing profiles in the study. The typical home was built around 1978 (47.9-year average),2 and the city’s water is very soft at 34 ppm (2 gpg),6 naturally filtered through thousands of feet of porous volcanic basalt, among the lowest mineral content supplies on the list. That softness translates to minimal limescale accumulation and low appliance wear from water chemistry. One caveat worth noting: Honolulu sits in USU Region 2 (Southwest), where asbestos cement pipe has historically been a significant part of the underground piping. Those moving into homes built before 1970 should specifically ask about underground pipe materials before making a decision.
5. Jacksonville, FL (Risk Score: 2.3/10)
Jacksonville’s infrastructure profile is generally favorable, a relatively young housing market with PVC-dominant underground infrastructure, and moderate water hardness. The typical home was built around 1983 (43.2-year average), with pre-1939 homes accounting for just 5%.2 Water hardness is a moderate 85 ppm (5 gpg),13 sourced from the Floridan Aquifer. One nuance worth noting: Jacksonville’s soft, low-pH water can be mildly corrosive to copper plumbing in older homes, increasing the risk of pinhole leaks over time. Those moving into pre-1980 neighborhoods should verify the pipe material before purchasing.
4. Portland, OR (Risk Score: 2.2/10)
Portland benefits from the most favorable underground infrastructure profile in the study. It sits in USU Region 1 (Pacific Northwest), where ductile iron is the dominant and trending pipe material, and the water main break rate of 4.2 per 100 miles per year is the lowest of any region nationally.1 Water is extremely soft at 11 ppm (0.6 gpg),14 sourced from the highly protected Bull Run watershed. The primary risk for Portland is very soft, low-pH water, which can be chemically corrosive to copper pipes and lead solder in older homes, potentially leaching metals into drinking water over time. Homes lacking complete plumbing facilities sit at 0.9%,3 above the study average, a signal of infrastructure inadequacy in the city’s older housing.
3. Austin, TX (Risk Score: 1.8/10)
Austin ranks among the lowest-risk cities in the study, driven by its young housing stock and PVC-dominant infrastructure. The typical home was built around 1988 (35.8-year average), with just 2.3% of stock predating 1939,2 one of the lowest pre-war concentrations in the dataset. Water hardness is a moderate 84 ppm (4.9 gpg),13 sourced from the Colorado River, well below the thresholds that generate meaningful scale accumulation. The city sits in USU Region 5 (Texas and Gulf South), where PVC is the dominant pipe material and water main break rates fall below the Midwest and Northeast averages. The primary risk for those moving to Austin is within the city’s older in-town neighborhoods.
2. Charlotte, NC (Risk Score: 1.1/10)
Charlotte’s housing stock is among the youngest in this study, and its infrastructure profile reflects that. The typical home was built around 1989 (36.7-year average), with more than half of all homes built after 1990,2 a product of the city’s decades-long status as one of the fastest-growing metros in the country. Water is soft at 34 ppm (2 gpg),15 sourced from protected surface reservoirs, Lake Norman and Mountain Island Lake, with minimal mineral content. The city sits in USU Region 7 with PVC as the dominant underground pipe material and a regional break rate of 5.7 per 100 miles per year,1 among the lowest in the national study. By nearly every measure in this index, Charlotte presents an infrastructure environment that is favorable for new prospective residents.
1. Raleigh, NC (Risk Score: 0.8/10)
Raleigh is the lowest-risk city in this analysis by a meaningful margin, with a profile in which virtually every risk factor either scores favorably or is effectively absent. The typical home was built around 1991 (34.7-year average), with over 60% of all homes built after 1990 and just 2.9% predating 1939,2 the youngest housing profile in the study. Water is very soft at 25 ppm (1.5 gpg),15 sourced from the protected Falls Lake and Benson Lake surface reservoirs, with no known lead service lines in the city’s distribution system. Homes lacking complete plumbing facilities register at effectively zero in census data.3 Raleigh sits in USU Region 7 with PVC as the dominant underground pipe material and a low regional water main break rate.1 2025 Roto-Rooter data shows 7.3 service calls per 100 households, a figure that reflects routine demand, not a housing stock under infrastructure stress. By every measure in this index, Raleigh represents the most favorable plumbing conditions of any market analyzed.
Full Rankings at a Glance
| Rank | City | Risk Score |
|---|---|---|
| 1 | Kansas City, MO/KS | 7.8 |
| 2 | Wilmington, DE | 7.8 |
| 3 | Camden, NJ | 7.6 |
| 4 | Bridgeport, CT | 7.5 |
| 5 | St. Louis, MO | 7.1 |
| 6 | Buffalo, NY | 7.1 |
| 7 | Dayton, OH | 6.8 |
| 8 | Cleveland, OH | 6.2 |
| 9 | Baltimore, MD | 6.1 |
| 10 | Pittsburgh, PA | 5.9 |
| 11 | Cincinnati, OH | 5.6 |
| 12 | Philadelphia, PA | 5.6 |
| 13 | Chicago, IL | 5.6 |
| 14 | Boston, MA | 5.1 |
| 15 | Minneapolis, MN | 5.1 |
| 16 | Indianapolis, IN | 5.0 |
| 17 | San Francisco, CA | 4.9 |
| 18 | Salt Lake City, UT | 4.9 |
| 19 | New York City, NY | 4.9 |
| 20 | Providence, RI | 4.8 |
| 21 | Middlesex, NJ | 4.8 |
| 22 | Westchester County, NY | 4.7 |
| 23 | Norfolk, VA | 4.7 |
| 24 | Los Angeles, CA | 4.2 |
| 25 | Long Island, NY | 4.2 |
| 26 | Northern Virginia | 4.1 |
| 27 | Omaha, NE | 3.9 |
| 28 | Fort Lauderdale, FL | 3.9 |
| 29 | Birmingham, AL | 3.8 |
| 30 | Columbus, OH | 3.7 |
| 31 | New Orleans, LA | 3.7 |
| 32 | Denver, CO | 3.7 |
| 33 | Phoenix, AZ | 3.6 |
| 34 | San Antonio, TX | 3.1 |
| 35 | Dallas, TX | 3.1 |
| 36 | Atlanta, GA | 3.1 |
| 37 | Tampa, FL | 3.0 |
| 38 | Houston, TX | 2.9 |
| 39 | Orlando, FL | 2.6 |
| 40 | Miami, FL | 2.5 |
| 41 | Honolulu, HI | 2.4 |
| 42 | Jacksonville, FL | 2.3 |
| 43 | Portland, OR | 2.2 |
| 44 | Austin, TX | 1.8 |
| 45 | Charlotte, NC | 1.1 |
| 46 | Raleigh, NC | 0.8 |
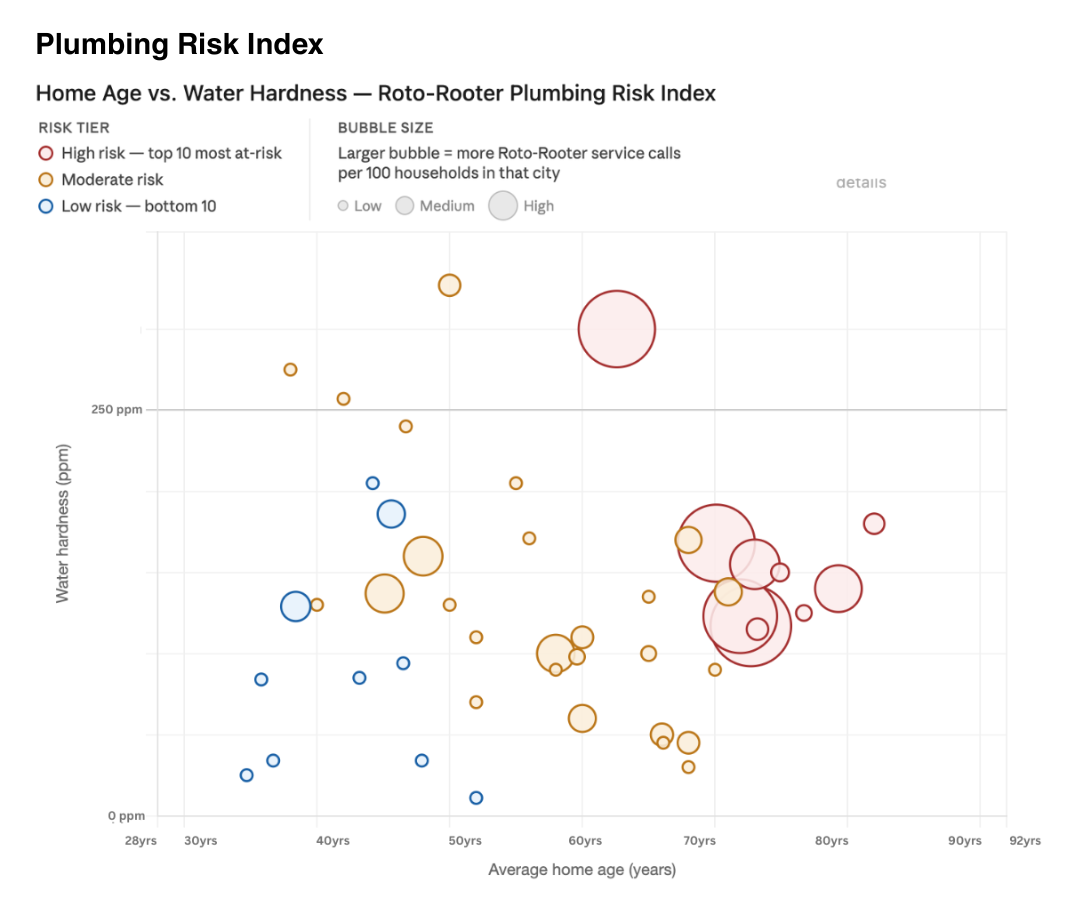
The chart below plots all 46 cities by average home age and water hardness, with bubble size reflecting service call volume per 100 households. Note that pipe material risk, the fifth factor in this index, is not represented visually, though nearly every top-ten city sits in the two highest-risk infrastructure regions in the country.
Before You Move
There is a reason the Rust Belt and Northeast dominate the top of this index. These are cities that built their housing stock during America’s industrial peak, roughly 1880 to 1940, when galvanized steel and cast iron were the only pipe materials available. For some cities, that housing was rarely replaced at the rate it aged, and the pipes beneath those streets are now 80 to 100 years old in many cases, operating in climates where freeze-thaw cycles stress already-failing infrastructure every single winter. Sun Belt cities carry a different risk, younger pipes, but very hard water in cities like Salt Lake City, Phoenix, and Kansas City that quietly degrades appliances and plumbing regardless of age, and warm-climate infrastructure that proved catastrophically vulnerable to unexpected temperature drops and cold snaps.
What both profiles share is that neither is visible in a standard home tour. A freshly painted basement won’t tell you what’s behind the walls. A working faucet won’t tell you what’s in the water. And whether you’re buying or renting, that distinction matters. Buyers have more leverage to request inspections, review disclosures, and negotiate repairs before closing. Renters often have less visibility into pipe materials and water quality and less recourse when something goes wrong, making it worth asking pointed questions before signing a lease.
Whether you’re moving into a new home or a new rental, the people most likely to have honest answers are your real estate agent, a local plumber, or a long-time resident of the neighborhood. Here are the questions worth asking:
- What material are the pipes, and when were they last updated?
- Has this property or street been flagged for lead service line replacement?
- What is the water hardness here, and does the home have a water softener?
- Has there been any history of water damage, sewer backup, or water main breaks nearby?
- Who handles plumbing repairs, and what’s the typical response time? (especially important for renters)
- Are the pipes insulated against freeze events? (for older homes in cold climates)
If you want to go a step further, a basic water quality test kit costs under $30 and can tell you more about what is coming out of your taps than most seller disclosures ever will. For anyone moving into a city in the top half of this index, it is a worthwhile investment.
Of the 46 cities analyzed in this study, some notably absent entries, including Detroit and Gary, may surprise readers. Their exclusion comes down to data availability. This study is limited to cities served by Roto-Rooter company-owned branches, where full and reliable service call data can be verified. As North America’s largest provider of plumbing repair and drain cleaning services, Roto-Rooter operates across the United States, but only locations with complete data were included to ensure the findings hold up.
The bottom line for anyone moving is the same regardless of which city you are headed to. A pre-move plumbing inspection is one of the most cost-effective steps you can take before committing to a new home, and in many of the cities on this list, it is the kind of thing you will be glad you did.
Methodology
Each of the 46 cities is scored across five categories, each normalized to a 0-10 scale before weighting. An adjustment based on climate is then applied. The result is a composite score where higher means greater plumbing risk.
Formula:
Normalization: Each raw metric is converted to a 0-10 score so cities can be compared fairly across categories:
The city with the highest raw value scores 10.0; the lowest scores 0.0. All others fall proportionally in between.
Category 1: Call Volume — Weight 25%
Source: Roto-Rooter service data, 2025 full year, across seven job categories: drain cleaning, jetting, plumbing repair, excavation, pumping, water quality, and water restoration.
How it’s calculated: Raw annual totals are divided by the number of households in each city (Census ACS 2023, Table B250014) and multiplied by 100 to produce a calls-per-100-households rate. This per-capita rate is what gets normalized, so a city of 30,000 households generating 22,000 calls isn’t obscured by a city of 1 million households with the same volume.
Category 2: Home Age — Weight 20%
Source: Census ACS 5-Year Estimates (2023), Table B25034 — Year Structure Built.2
How it’s calculated: Each decade bucket (e.g. “Built 1980 to 1989”) is assigned a midpoint year (1984.5). That midpoint’s age relative to 2026 (41.5 years) is multiplied by the number of homes in the bucket. The weighted values across all ten buckets are summed and divided by the total homes to produce a single weighted average age in years.
Home age is the most reliable proxy for pipe age. Homes built before 1960 frequently contain galvanized steel or cast-iron pipes at or past their 50-80 year design life. The USU study found the average age of a failing water main nationally is 53 years.1
Category 3: Water Hardness — Weight 20%
Source: HardWaterHQ.com and AquaTell.com for 25 cities; individual municipal Consumer Confidence Reports for remaining cities.
How it’s measured: Hardness is expressed in milligrams per liter (mg/L) or parts per million (ppm); the higher the number, the more dissolved calcium and magnesium in the water. Hard water scales pipes and appliances; very soft water can corrode metal pipes from the inside.
| Classification | mg/L | gpg |
|---|---|---|
| Soft | 0–60 | 0–3.5 |
| Moderately Hard | 61–120 | 3.5–7 |
| Hard | 121–180 | 7–10.5 |
| Very Hard | 181–250 | 10.5–14.6 |
| Extremely Hard | 250+ | 14.6+ |
Category 4: Homes Lacking Complete Plumbing — Weight 15%
Source: Census ACS 5-Year Estimates (2023), Table B25048.3 A home lacks complete plumbing if it is missing hot and cold running water, a bathtub or shower, or a flush toilet.
Why it matters: This is a proxy for housing stock in severe disrepair. Cities with higher rates tend to have older, less-maintained homes with greater deferred maintenance across the board.
Category 5: Pipe Material and Regional Infrastructure — Weight 20%
Source: Barfuss, S.L. (December 2023). Water Main Break Rates in the USA and Canada. Utah State University.1 Based on 399,812 miles of pipe across 802 US utilities.
How it’s scored: Each region is scored 1 to 5 based on its dominant pipe material and published break rate. That score is then stretched to a 0 to 10 scale, where the lowest-risk region scores a 0 and the highest scores a 10, keeping it consistent with the other categories in the index.
| Score | Region | Dominant Pipe | Break Rate |
|---|---|---|---|
| 5 | Region 8: Northeast/Mid-Atlantic | Cast iron | 16.4/100 mi/yr |
| 4 | Region 6: Midwest/Great Lakes | Cast iron + ductile iron | 14.6/100 mi/yr |
| 3 | Regions 2, 3, 4: Southwest/Mountain/Plains | Mixed/asbestos cement | 6.5–13.4/100 mi/yr |
| 2 | Regions 5, 7: South/Southeast | PVC trending | 5.7–12.9/100 mi/yr |
| 1 | Region 1: Pacific Northwest | Ductile iron | 4.2/100 mi/yr |
Cast iron fails at 28.6 breaks per 100 miles per year, nearly ten times PVC’s rate of 2.9. 86% of US cast iron pipe is over 50 years old.1
Climate Adjustment
Applied after normalization to capture two types of stress the five categories don’t fully reflect.
Freeze-thaw (cold climates): Water expands 9% when it freezes, bursting pipes outright. The USU study identifies circumferential cracking, caused primarily by freeze-thaw, as the most common pipe failure mode nationally at 48%.1 Cold cities receive a positive adjustment.
Heat stress (warm climates): Chronic rather than acute clay soil expansion, UV degradation of above-ground PVC, and accelerated root intrusion. Warm-climate cities also tend to have pipes not engineered for the occasional hard freeze, as Texas demonstrated in February 2021. Warm cities also receive a positive adjustment.
| Category | Cities | Adjustment |
|---|---|---|
| Very Cold | Buffalo, Chicago, Cleveland, Minneapolis | +1.0 |
| Cold | Baltimore, Boston, Camden NJ, Cincinnati, Columbus, Denver, Indianapolis, Kansas City, Long Island, Middlesex NJ, New York, Northern Virginia, Omaha, Philadelphia, Pittsburgh, Providence, Salt Lake City, St Louis, Westchester NY, Wilmington DE | +0.5 |
| Mild | Atlanta, Birmingham, Charlotte, Los Angeles, New Orleans, Norfolk, Portland, Raleigh, San Francisco | +0.0 |
| Warm/Humid | Austin, Dallas, Fort Lauderdale, Houston, Jacksonville, Miami, Orlando, San Antonio, Tampa | +0.3 |
| Hot/Arid | Honolulu, Phoenix | +0.2 |